ANALYSIS & PUBLICATIONS
Current Project Pipeline in Wind Projects in Türkiye

After 2020 and 2021, which were intense years for the commissioning of new wind projects, the Turkish Wind Energy Sector completed 2023 with a performance below the average of recent years with approximately 540 MW of installation. In order to shed light on wind power plant installation forecasts in the coming years, we tried to analyze the current project pipeline in wind projects in Turkey as of July 2024 in this issue of Rüzgar Enerjisi Dergisi.
This analysis was made based on EMRA’s current data on the EMRA website as of July 2024 and TÜREB Turkey Wind Energy Statistical Report January 2024 data.
Annual Installation of Wind Power Plants in Türkiye (TÜREB)

Project Pipeline coming from Licensed Projects
There are currently 301 licensed wind power plant projects in Türkiye. While 25 of these licensed projects are new/greenfield projects that have not yet been put into operation, the remaining 276 wind projects are projects that have been partially or fully commissioned or have received a capacity increase. The installed power analysis of all licensed wind projects across Türkiye is given in the table below. According to this table, as of July 2024, approximately 3 GW of licensed wind capacity has been licensed but has not yet been put into operation.
Capacity Analysis of Licenced Wind Projects of Türkiye | |||
Capacity | “Licenced | “Operational | “Difference |
Mechanical Capacity (MWm) | 15.742 | 12.766 | 2.976 |
Electrical Capacity (MWe) | 14.853 | 12.055 | 2.798 |
A project-based review of this project stock of approximately 2.96 GW, belonging to 152 licensed wind projects that are not yet in operation/partially in operation, is made in the table below. As seen in this table, a significant portion of the uncommissioned capacity, up to 2.3 GW, is in projects with Capacity Extensions or Partial Acceptance. Since the energy transmission line, switchgear and other infrastructures of these projects, which are currently in operation, are already in place, this capacity of 2.3 GW constitutes the project stock that will turn into investment most quickly.
Analysis of Licenced Capacity Which is NOT in Operation Yet | ||
Number of Projects | Total Capacity of Projects Licenced but NOT operational yet (MWm) | |
Türkiye General Licenced Capacity Which is NOT in Operation Yet | 152 | 2976 |
Greenfield / Brandnew projects [Projects which have not any operational capacity ] | 25 | 693 |
Capacity Extensions and Partially Operational Projects | 128 | 2283 |
When the distribution of this project stock on a provincial basis is examined, Çanakkale, Istanbul and Kırklareli provinces will be our top three provinces for the installation of new wind turbines in the near future, and approximately 25% of the project pipeline is concentrated in these three provinces. In the table below, 20 provinces that are likely to increase wind capacity in the near future are shared. A total of 2.1 GW of new wind capacity can be expected to be installed in these 20 provinces.
Licenced but NOT operational Capacity Analysis based on Province | ||
Province | Capacity [ Licenced but not operational yet ] (MWm) | |
1 | ÇANAKKALE | 300 |
2 | İSTANBUL | 242 |
3 | KIRKLARELİ | 197 |
4 | SİVAS | 125 |
5 | SAKARYA | 123 |
6 | İZMİR | 108 |
7 | KIRIKKALE | 83 |
8 | BİLECİK | 82 |
9 | UŞAK | 82 |
10 | BALIKESİR | 77 |
11 | TRABZON | 72 |
12 | VAN | 72 |
13 | OSMANİYE | 69 |
14 | HATAY | 68 |
15 | ISPARTA | 66 |
16 | TEKİRDAĞ | 64 |
17 | AYDIN | 64 |
18 | MUĞLA | 64 |
19 | BURSA | 62 |
20 | ORDU | 60 |
Project Pipeline coming from PreLicenced Projects
We can group pre-licenced wind projects into two different groups: Storage and Non-Storage projects.
Non-Storage Wind Projects are comprised of projects that were entitled to a pre-license before Wind Projects with Storage application, and mostly developed by investors as a result of YEKA 1, 2 and 3 tenders. In this category, a total of 60 different wind projects constitute a project stock of 4.1 GW.
In Wind Projects with Storage, there is a total project pipeline of approximately 19 GW with approximately 263 Projects.
Analysis of Pre-Licenced Wind Projects | |||
Wind Project Type | Pre-Licence Stiuation | Number of Projects | Total Installed Capacity (MWm) |
Pre-Licenced Projects (Non Storage) (Majority of projects are coming from YEKA 1 / 2 / 3 tenders.) | CurrentlyPre-Licenced | 60 | 4.132 |
Pre-Licenced Projects with Storage | CurrentlyPre-Licenced | 247 | 17.890 |
Pre-Licence Applications under Evaluation Stage | 16 | 1.022 |
The below table shows tenders or periods of pre licenced wind projects (Non Storage) without storage obligation. Here, the projects which are coming from tenders / applications made in 2017 and before, have the highest share both in the number of projects and in terms of installed capacity.
Pre Licence Wind (Non Storage) Capacity Analysis (no storage obligation) | ||
Tender / Application Period Pre-Licence is coming from | Number of Projects | Total Capacity (MWm) |
YEKA 1 Projects | 6 | 1.000 |
YEKA 2 Projects | 6 | 639 |
YEKA 3 Projects | 20 | 1.190 |
“Projects coming from | 28 | 1.303 |
Total | 60 | 4.132 |
Current Project Pipeline in Wind Projects in Türkiye and Evaluations
If we bring together all the projects at the licence and pre-license stages, a total of 475 different projects and a project pipeline of 26 GW wind projects will be available for the wind industry in Türkiye.
Türkiye’s Current Wind Projects Pipeline | ||||
Project’s Licence Stiuation | Licence / Pre-Licence Stiuation | Number of Projects | “Total Capacity | “Capacity Analysis accoridng to Storage Obligation |
“Project Pipeline Coming from Licenced Projects | “Currently | 152 | 2.976 | 7.108 |
“Pre-Licenced Projects | “Currently | 60 | 4.132 | |
“Pre-Licenced Projects | “Currently | 247 | 17.890 | 18.912 |
Pre-Licence Applications under Evaluation Stage | 16 | 1.022 | ||
TOTAL | 475 | 26.020 |
- In the light of this analysis, the following evaluations can be made about the current project pipeline in wind projects in Turkey;
- Since Wind Projects with Storage are still in the development phase, the realization of approximately 19 GW of project pipeline coming from these projects can be predicted to be in 2027 and beyond, considering all permit processes and turbine supply processes.
- Project Pipeline of 7.1 GW comins from Licensed and Pre-License Wind (Non-Storage Projects) Projects can be considered as the projects whihc are closest to the investment and can be operational in 2024, 2025 and 2026. However, Considering the delays in YEKA 1 Projects, the future project pipeline coming from this category can be considered as 6.1 GW.
- According to TÜREB’s Türkiye Wind Energy January 2024 Statistical Report, Türkiye’s operational wind installed power is 12,482 MWm and the projects under construction is 3,148 MWm.
- According to EMRA’s July 2024 data, the operational wind capacity in Turkey is 12,766 MWm.
- When we combine these two data, approximately 284 MWm of power has been put into operation in the first six months of 2024, and the current installed power under construction can be considered as 2,864 MWm.
- When the 2.86 GW under construction capacity is subtracted from the 6.1 GW Project Pipeline coming from Licensed and Pre-License Wind (Non-Storage Projects) Projects, 3.24 GW Project Pipeline has not yet reached the investment stage.
- A significant portion of the 3.24 GW Project Pipeline that has not reached the investment phase can be expected to be converted into investment within the next 6 to 12 months.
- Although there is serious activity in unlicensed wind projects, most of the projects have low capacities. Many of the projects in this area are at the project development stage, and the annual contribution to new wind installations can be expected to be in the range of 50 to 100 MW.
- In the light of these evaluations, it can be predicted that new wind installations in 2024 will approach 1,000 MW, and new installations in 2025 and 2026 will be in the range of 1,000 to 1,500 MW.
Habib Babacan
Habib Babacan has been working professionally in the Turkish Wind Energy sector since 2008. He continues to provide consultancy services, with his own initiative, Mature Capital, to investors in the fields of Business Development, Project Development, Strategy Formulation and M&A of Projects in the wind business.
More information about Mature Capital, which focuses on Mergers and Acquisitions of Wind Projects (M&A), is available through the links below.


Wind Energy Reports
Offshore wind installed capacity reaches 83 GW as new report finds 2024 a record year for

The Global Wind Energy Council’s flagship Global Offshore Wind Report, released today, shows that the offshore wind industry added another 8GW of capacity in 2024, making it the fourth highest year ever. This brings total installed offshore wind capacity globally to 83 GW – enough to power 73 million households.
Government auctions awarded 56 GW of new capacity globally last year, a record figure, while the industry is already constructing another 48 GW of offshore wind worldwide, also a record figure. The report highlights the significant policy and regulatory breakthroughs that are forming the next stage of offshore wind markets in countries including Japan, South Korea and the Philippines.
However, despite the strong pipeline, the report shows that macroeconomic headwinds, failed auctions, supply chain constraints and increasing policy instability, particularly in the US, have contributed to a downgrading of GWEC’s short term outlook.
The report warns that, whilst the fundamental case for offshore wind has never been stronger, the sector is facing an inflection point. GWEC recommends that industry and governments now need to urgently work together to redesign auction processes to focus on delivery and better risk sharing so that offshore wind can fulfil its vital role in providing large scale and secure clean power. The report also finds that the fundamentals of offshore wind have not changed, and the mid-term outlook remains strong.
GWEC’s Global Offshore Wind Report shows there is now 83GW of offshore wind capacity across the world, enough to power 73 million households. GWEC’s Market Intelligence team forecasts annual offshore wind capacity installations to grow from 8GW in 2024 to 34GW in 2030. However, GWEC’s short-term outlook is 24% lower than the previous year’s forecast due to a negative policy environment in the US and auction failures in the UK and Denmark. Adding to these challenges are transmission delays in Europe and slower commissioning in the APAC region, meaning that, while growth continues, it is happening at a slower pace.
Annual growth rates are expected to be 28% until 2029, and 15% up to 2034, which, in capacity-terms, means the industry will still sail past the milestones of 30GW annually in 2030 and 50 GW by 2033.
While near-term growth is concentrated in the already established markets in Europe and China, GWEC reports offshore wind pushing into new regions such as Asia-Pacific and Latin America. In Japan, South Korea, Philippines, Vietnam, Australia, Brazil and Colombia, government is working with the industry to establish policies and regulations to fast-track offshore wind. This signals policymaker commitment and sets the stage for the sector’s next wave of market expansion.
The Key Data
In 2024, 8 GW of new offshore wind capacity was grid-connected worldwide. New additions were 26% lower than the previous year, making 2024 the fourth-highest year in offshore wind history.
The global offshore market grew on average by 10% each year in the past decade, bringing total installations to 83.2 GW, which accounted for 7.3% of total global wind capacity as of the end of 2024.
China led the world in new offshore wind installations for the seventh year in a row, followed by United Kingdom, Taiwan (China), Germany and France. The top five markets made up 94% of the new additions in 2024.
China is the absolute market leader for cumulative offshore wind installations, accounting for half of the global market share, followed by the UK. Germany, the Netherlands and Taiwan (China) complete the top five. Offshore wind pioneer Denmark dropped out of the top five for the first time.
At the end of 2024, a total of 278 MW net floating wind was installed globally, of which 101 MW in Norway, 78 MW is in the UK, 40MW in China, 27MW in France, 25 MW in Portugal, 5 MW in Japan and 2 MW in Spain.
The report forecasts a compound average growth rate of 21% for the offshore wind industry, which means another 350 GW of offshore wind energy capacity to be added over the next decade (2025–2034), bringing total offshore wind capacity to 441 GW by the end of 2034.
Annual offshore wind installations are expected to double in 2025, triple in 2027 and then sail past the milestones of 30 GW in 2030. By 2034, they are expected to reach 55 GW, bringing the offshore share of new wind power installations from today’s 7% to about 25%.
China and Europe will continue to dominate offshore wind growth going forward but their global market share in cumulative installations is expected to drop to 89% in 2029 and 84% in 2034, because of growth in markets outside the two key markets in APAC, North America and Latin America.

YEKA is the abbreviation of capital letters of “Yenilenebilir Enerji Kaynak Alanları” which means Renewable Energy Resource Zones. RES is the abbreviation of capital letters of “Rüzgar Enerji Santrali” which means Wind Energy Power plant.
Ministry of Energy of Türkiye executes wind tenders for YEKA RES zones since 2017, and so far 2850 MW capacity was tendered in the first three YEKA RES competitions; respectively – 1000 MW in 2017, 1000 MW in 2019, and 850 MW in 2022. Tender eligibility requirements and competition rules were different in all these three tenders. However, the common point for these three tenders, in none of them projects were developed.
Projects were pre-developed in YEKA-4 RES 2024
YEKA-4 RES 2024 Competition was announced on 28 October 2024 for a connection capacity of 1200 MW in five different projects. Different than before in this tender, the announced projects were pre-developed by Ministry and long-term wind measurements were carried out, site coordinates, and even turbine coordinates are defined, and development data was shared with tender participants.
Here are some highlights for this tender rules are given in below table.
| Table 1: Highlights of YEKA 4 RES – 2024 Auction | ||
|---|---|---|
| Topic | Details | Explanation |
| Capacity Tendered | 1200 MW | – 5 different projects |
| Pre-Licence Period (for Electricity Generation) | 24 months | – Starts with issuance of Pre-Licence, usually 6 months after the signature of YEKA Agreement |
| Licence Period (for Electricity Generation) | 49 years | – 49 years after the prelicence period |
| Local Content Requirement (applied to main components, and some sub components) | Minimum 55% | – No local nacelle or other factory obligation. – Supply of selected components should exceed 55% point. – All locally supplied subcomponents should exceed certain localization ratios. |
| Electricity Sales with Market Rates | First 72 months after the signature of YEKA Agreement | – This period starts approximately on 31 March 2025 and lasts 72 months. – This 72 months includes remaining project development activities including permits, design and turbine selection, as well as construction period of wind farm. – For the winner, earlier completion is better to benefit from electricity market rates. |
| Competition Electricity Sales – Feed in Tariff & Contribution Fee | – First bid shall be given between 5.5 to 3.5 USDCents/kWh. – Reverse Auction continues until it reaches 3.5 USDCents/kWh. – After reaching 3.5 USDCents/kWh, auction off for Contribution Fee in USD per MW. Highest Contribution Fee bidder is the winner. | – Feed in tariff (USDCent/kWh) shall continue for 20 years. – This 20-year period starts 72 months after the signature of YEKA Agreement. – No annual escalation for the winning bid.- Contribution Fee is in USD per MW, and paid just after the signature date of YEKA Agreement. [Until 31 March 2025]. Winning bid should pay [Contribution Fee X Project Installed Capacity]. |
Tender Applications
Deadline for YEKA-4 RES 2024 was 21 January 2025, and investors were given around three months of time for preparations. Since Turkish wind market is eager for the developed wind projects, interest from the local investors were high, and 40 different investor groups were applied for the competition. The below table shows number of bidders for each project. Since the investment amount (CAPEX) increases with the capacity, more applicants were seen for smaller capacities. However, even 14 applicants for 410 MW Edirne RES Project were enough for a tough competition.
| Table 2: YEKA 4 RES – 2024 Projects & # of Bids | ||||
|---|---|---|---|---|
| # | Project Name | Province | Installed Capacity | No of Bidders |
| 1 | R24- EDİRNE RES | EDİRNE | 410 MW | 14 |
| 2 | R24- BALKAYA RES | KIRKLARELİ | 340 MW | 16 |
| 3 | R24- SERGEN RES | KIRKLARELİ | 200 MW | 21 |
| 4 | R24- YELLİCE RES | SİVAS | 160 MW | 23 |
| 5 | R24- GÜRÜN RES | SİVAS | 90 MW | 26 |
Tender Results
In all these five projects tenders, first offers for feed in tariff which were provided within the closed envelopes contains minimum tariff of 3,5 USDcents/kwh. Therefore, reverse auction rounds for feed in tariffs were not carried, tenders directly started with auctioning off Contribution Fee per MW after the opening of closed offers.
Tender rounds for all five projects were very competitive in increasing contribution fees, even after reaching to lowest feed-in tariff of 3,5 USDcent/kwh for 20 years without annual escalation. Table 3 shows results of tender with the winning investors, and auction rounds.
| Table 3: YEKA 4 RES – 2024 Results | |||||||
|---|---|---|---|---|---|---|---|
| # | Project Name | Province | Installed Capacity | Investor / Winning Bidder | Feed-in-Tariff ($cent/kWh) | Contribution Fee (USD/MW) | Auction Rounds |
| 1 | R24- EDİRNE RES | EDİRNE | 410 MW | ENERJİSA ENERJİ ÜRETİM A.Ş. | 3,50 | $60.000 | 5th Round |
| 2 | R24- BALKAYA RES | KIRKLARELİ | 340 MW | ENERJİSA ENERJİ ÜRETİM A.Ş. | 3,50 | $92.000 | 5th Round |
| 3 | R24- SERGEN RES | KIRKLARELİ | 200 MW | RT ENERJİ TURZ. SAN. VE TİC. A.Ş. | 3,50 | $140.000 | 8th Round |
| 4 | R24- YELLİCE RES | SİVAS | 160 MW | EFOR HOLDİNG A.Ş. | 3,50 | $140.000 | 4th Round |
| 5 | R24- GÜRÜN RES | SİVAS | 90 MW | ADY AKDENİZ RÜZGAR EN. ÜR. A.Ş. | 3,50 | $148.000 | 11th Round |
Next Step for the short term period for YEKA-4 RES 2024
The winning bidder for each project will be invited by the Ministry for the signing of YEKA Agreements, and afterward total contribution fee shall be paid in full amount until 31 March 2025 to EPİIAS which is electricity market operator. Table 4 shows the total contribution fee amount for each project.
| Table 4: YEKA 4 RES – 2024 Contribution Fee to be paid until 31 March 2025 | ||||||
|---|---|---|---|---|---|---|
| # | Project Name | Province | Installed Capacity (MW) | Investor / Winning Bidder | Contribution Fee (USD/MW) | Total Contribution Fee (USD) |
| 1 | R24- EDİRNE RES | EDİRNE | 410 | ENERJİSA ENERJİ ÜRETİM A.Ş. | $60.000 | $24.600.000 |
| 2 | R24- BALKAYA RES | KIRKLARELİ | 340 | ENERJİSA ENERJİ ÜRETİM A.Ş. | $92.000 | $31.280.000 |
| 3 | R24- SERGEN RES | KIRKLARELİ | 200 | RT ENERJİ TURZ. SAN. VE TİC. A.Ş. | $140.000 | $28.000.000 |
| 4 | R24- YELLİCE RES | SİVAS | 160 | EFOR HOLDİNG A.Ş. | $140.000 | $22.400.000 |
| 5 | R24- GÜRÜN RES | SİVAS | 90 | ADY AKDENİZ RÜZGAR EN. ÜR. A.Ş. | $148.000 | $13.320.000 |
About Habib Babacan
Habib Babacan has been working professionally in the Turkish Wind Energy sector since 2008. He continues to provide consultancy services, with his own initiative, Mature Capital, to investors in the fields of Business Development, Project Development, Strategy Formulation and M&A of Projects in the wind business.
More information about Mature Capital, which focuses on Mergers and Acquisitions of Wind Projects (M&A), is available through the links below.
https://www.maturecapital.com.tr
https://www.linkedin.com/company/mature-capital-m/

Global investment in renewable energy has undergone significant growth over the past decade. According to the International Renewable Energy Agency (IRENA), the world’s total renewable energy capacity increased from 1,226 GW in 2010 to 2,799 GW in 2020, more than doubling in just ten years (1). This trend highlights the critical role of renewable energy in meeting sustainability and energy security goals, and in mitigating climate change. However, climate change itself, through extreme weather events and shifting environmental conditions, can pose new “physical risks” that wind power and other renewable energy facilities must anticipate and manage. Our company provides data-driven solutions—encompassing climatological, meteorological, and topographical information—to help investors, insurers, and banks address these emerging challenges.
The Physical Risk Landscape
Wind, solar, and hydropower facilities operate under open-air conditions, making them particularly vulnerable to disruptions caused by climate change. Extreme heatwaves, flooding, icing, lightning, and wildfires are among the hazards affecting both the construction and operational phases of renewable energy projects. For example, in colder regions, such as Canada, ice accretion increases maintenance costs. It poses safety risks, whereas, in countries like Türkiye, wildfires and frequent lightning strikes can significantly threaten infrastructure and operational stability.
Our specialized climatological datasets provide valuable insight into current and future risk profiles for any given location. We integrate historical reanalysis data with validated climate projections using advanced numerical algorithms, which enables stakeholders to identify the severity of these risks under different scenarios. This holistic approach provides investors, insurers, and financiers a robust foundation for making informed decisions, from initial site selection to long-term asset management.
The Role of Insurance and Banking Sectors
Insurance companies have a vested interest in accurately assessing physical risks at the earliest stages of a project. By leveraging our high-resolution climate projections, they can develop risk scores that capture the likelihood and potential impact of hazards, such as extreme temperatures, lightning, or wildfire. In turn, this allows insurers to structure more precise policies, establishing coverage and premiums that reflect the true level of exposure throughout a project’s operational life cycle.
Banks, too, are increasingly aware of how climate change can threaten the viability of their investments. Traditionally, lenders have focused on collateral and revenue projections when evaluating project financing. Nowadays, institutions, such as the International Finance Corporation (IFC), the European Bank for Reconstruction and Development (EBRD), and the European Investment Bank (EIB) require investors to submit detailed climate risk assessments (2). These assessments help demonstrate the project’s environmental benefits and the borrower’s resilience strategy against future climate uncertainties. As a result, credit approvals now hinge more strongly on whether investors have factored in physical climate risks and taken adequate measures—often involving both adaptive engineering solutions and firm risk mitigation plans.
Data-driven Decision Making
Selecting a wind power plant site is a multifaceted process, balancing factors, such as wind resource potential, proximity to transmission lines, and local construction conditions. However, climate-driven risks—like future wildfire probability or increased frequency of intense storms—must no longer remain an afterthought. If a given climate projection indicates a heightened risk of wildfires, for instance, and the topographical data shows dense forestation near the planned site, additional investments in fire suppression systems or auxiliary firefighting equipment may be prudent. In areas with higher lightning frequency, the capacity of lightning protection systems might need upgrading from, say, a 25 kA to a 50 or even 75 kA system to ensure operational continuity.
Our company’s ultimate goal is to provide an online platform where investors, insurers, and banks can collaboratively monitor and assess these data-driven insights. By integrating our analysis into standard feasibility and “bankable” reports, decision-makers gain a clearer understanding of how climate change could affect both the short-term performance and the long-term resilience of their investments.
Conclusion
As the world increasingly relies on wind, solar, and hydropower to bridge the energy gap and reduce carbon emissions, the sector must prepare for the physical risks introduced by the changing climate. While providing cleaner and more sustainable energy, these projects are inherently exposed to environmental extremes. With our high-resolution climate analytics and tailored data products, we empower stakeholders to identify, quantify, and respond to risks with greater precision. In a future marked by uncertainty, a shared focus on robust, data-driven adaptation will be essential for ensuring that renewable energy investments fulfill their potential in both sustainability and resilience.
References
1. IRENA (2021). Renewable Capacity Statistics 2021. International Renewable Energy Agency.
2. IFC (2018). Climate Investment Opportunities in Emerging Markets. International Finance Corporation.
This article is based on the solutions and expertise our company provides, aiming to enhance the resilience of renewable energy projects against climate-induced physical risks.


 Events8 years ago
Canada and Turkey women working in the renewable energy sector in met
- Turbine Technologies7 years ago
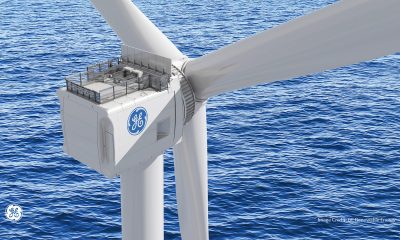
GE’s Haliade-X 12 MW prototype to be installed in Rotterdam
- Operations and Maintenance8 years ago
GENBA is on the rise; another milestone passed by in global existence
- Genel11 years ago
EWT launches the DW61, It’s most efficient and high energy producing wind turbine
- Genel11 years ago
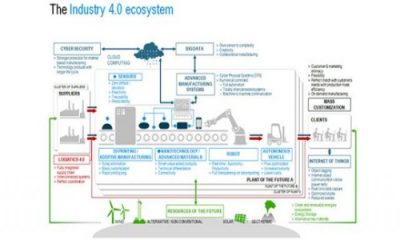
Internet of things will empower the wind energy power plants
- Turbine Technologies8 years ago
İğrek Makina focused on developing and producing Machine Tools and Wind Energy Turbines
- Legal & Financial Solutions8 years ago
Demand/Supply – Renewable energy with guarantees of origin (GO)
- Events7 years ago
Key Players from 10 Nations will Show Their Strong Positions at APWEE
- Turbine Technologies6 years ago
ENERCON installs E-160 EP5 prototype
- Turbine Technologies7 years ago
The Nordex Group receives first order for Delta4000 turbines from the USA
- Turbine Technologies8 years ago
ENERCON and Lagerwey together develop two new WEC types
- Genel10 years ago
Zorlu energy envisages a bold new future based on renewables